Running Grafana Kiosk on a Raspberry pi
@kjuulh2023-07-26
Introduction
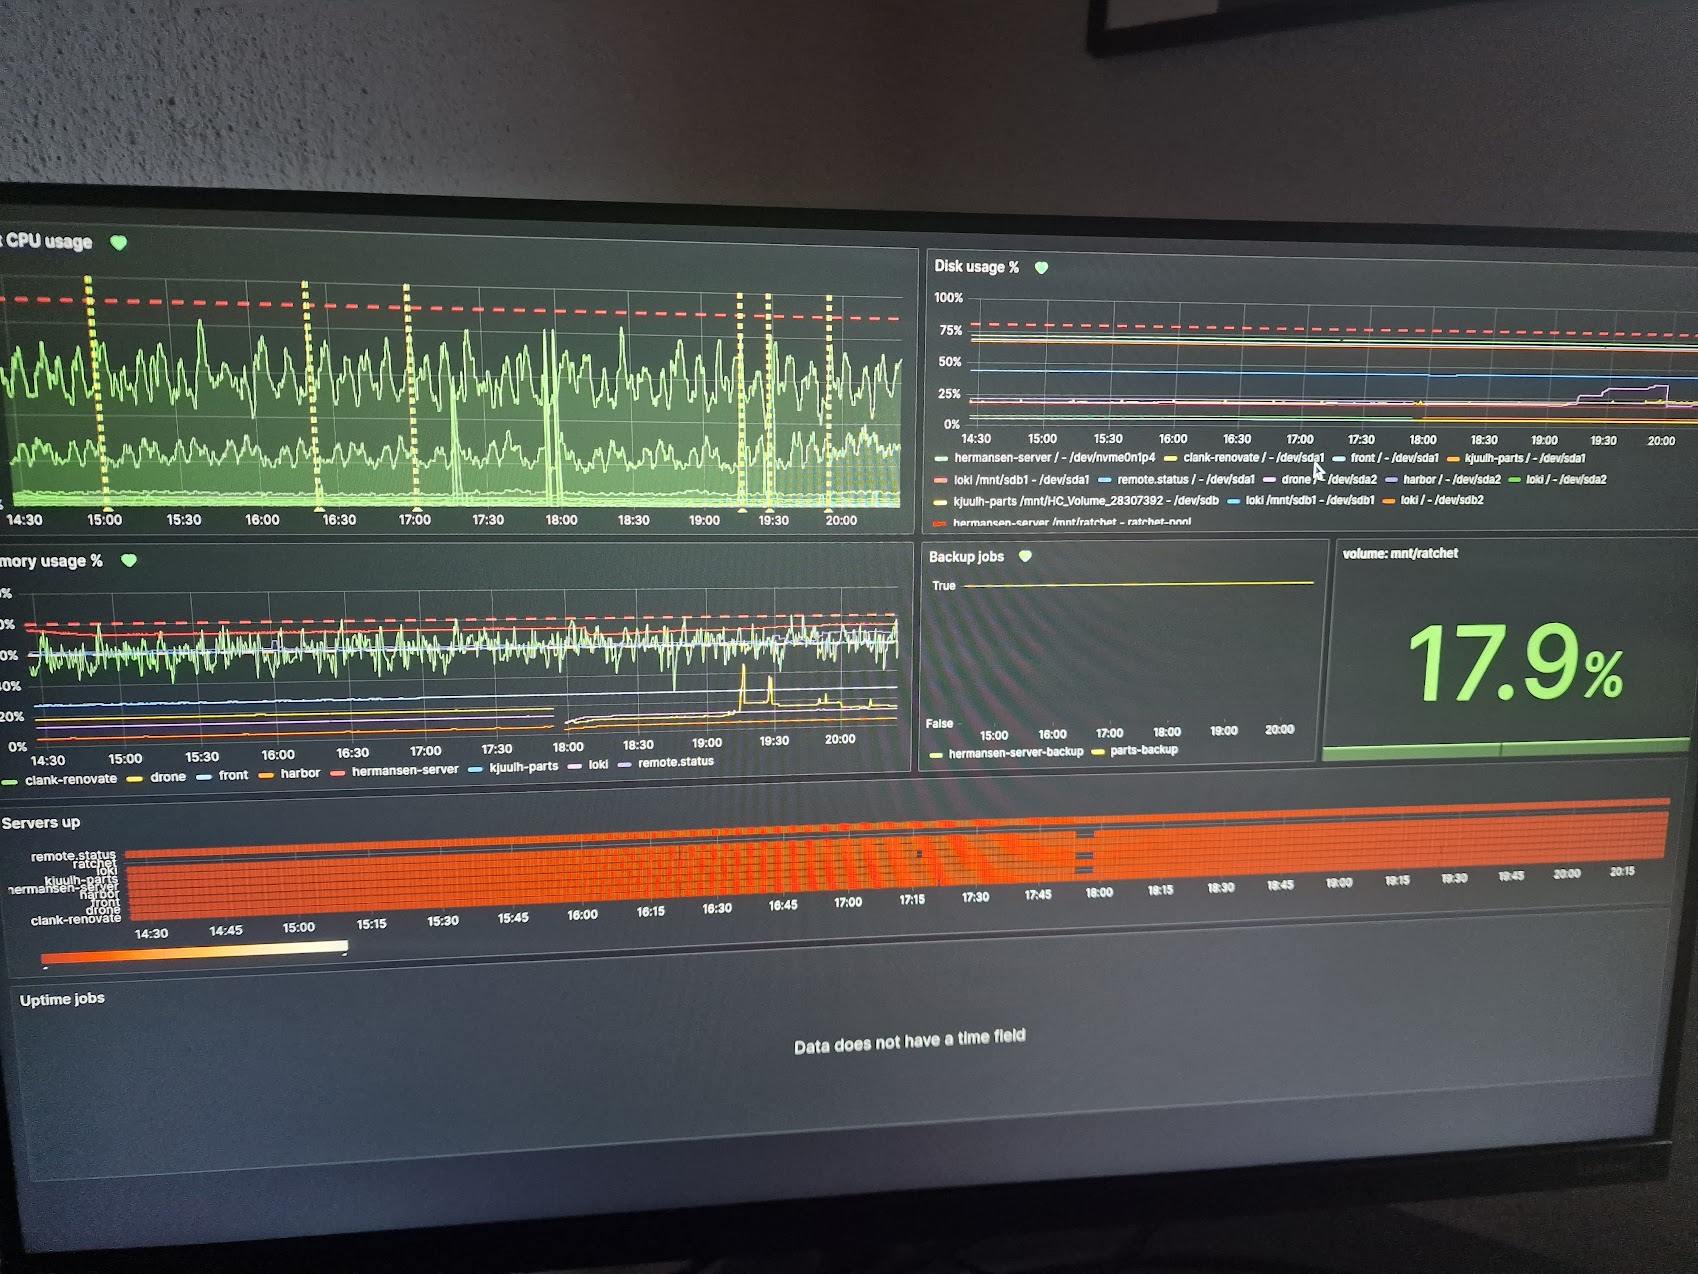
The motivation behind setting up a raspberry pi for kiosk mode, and sacrificing a tv, is that at work we've got kind of this control center factor, where at a glance, we can quickly get an overview of a problem. If an alert goes, it is super easy to just look up and there you go, you can see the spike in CPU, requests you name it.
And it looks super cool :D
Prerequisites
You are gonna need a raspberry pi (ofc) or another small mini pc. It doesn't technically have to be a raspberry pi, but the official docs, and this guide is certainly geared towards it.
I am using a:
- Raspberry pi 4
- A monitor / TV. I am usually using the tv.
- A grafana server somewhere reachable by the raspberry pi
Installation
I won't go too deep into the installation, I've used the raspberry pi imager, to setup an sd-card, with raspberryp os 64 bit, You may have to choose the 32 bit version if you're running on an older pi. I am choosing the default, not the lite version, you want the desktop to be setup.
You can change the name of the user if you want, you will just have to swap out the pi username later.
Simply hook it up to a display, get a keyboard and mouse (or ssh connection), I did everything through an ssh connection personally.
Grafana-kiosk
Grafana actually publishes an app for running a kiosk mode grafana dashboard, it is just a single binary and can be fetched from their github page: https://github.com/grafana/grafana-kiosk
Simply download the binary that you need:
lscpu | grep Arch
First figure out which architecture you're on. Raspberry pi 4 returns aarch64, which maps to linux-arm64. Older raspberry pi editions, map to an armv7 or below (I believe)
Next grab the release (make sure to look for an updated version)
export VERSION="v1.0.6" # as of 2023-07-26
export KIOSK_ARCH="linux.arm64"

wget "https://github.com/grafana/grafana-kiosk/releases/download/$VERSION/grafana-kiosk.$KIOSK_ARCH"

chmod +x "grafana-kiosk.$KIOSK_ARCH"
Now you should have got the executable in the home directory, you are free to move it to a more appropriate place, but make sure to update the paths later.
Now give it a whirl using the default settings, this will show stats from a template grafana dashboard provided by grafana themselves.
./grafana-kiosk.$KIOSK_ARCH
After a few seconds the built in chromium browser will open and you should see
the grafana page loading. To turn it off simply Ctrl+C the process.
Now we have a few choices for auto-setup. The official docs mention a few different ways you can do it: https://github.com/grafana/grafana-kiosk/blob/main/README.md#automatic-startup
I will personally use systemd, as it is a fairly convenient and homogenous way of doing it. I am also not running LXDE on my workstation, so I'd rather choose something I am slightly more familiar with.
Setup Systemd
First we need to create a systemd service. I am personally using neovim, but you are free to choose regular vim or nano, if you prefer.
First grab yourself a super user session
sudo su
<enter password>
And create the file
nvim /etc/systemd/system/grafana-kiosk.service
Now enter the contents:
[Unit]
Description=Grafana Kiosk
Documentation=https://github.com/grafana/grafana-kiosk
Documentation=https://grafana.com/blog/2019/05/02/grafana-tutorial-how-to-create-kiosks-to-display-dashboards-on-a-tv
After=network.target

[Service]
User=nefarious
Environment="DISPLAY=:0"
Environment="XAUTHORITY=/home/nefarious/.Xauthority"

ExecStartPre=/bin/sleep 30
ExecStartPre=xset s off
ExecStartPre=xset -dpms
ExecStartPre=xset s noblank

ExecStart=/home/pi/grafana-kiosk.linux.arm64 -URL <your-playlist-url> -login-method local -username <your-user> -password <your-password> -playlists true -lxde-home /home/pi/ -lxde true

[Install]
WantedBy=graphical.target
This is specifically setup to use playlists, if you want to do the same, simply create or view a playlist in grafana, and copy the shareable link or url to it. Simple as that. I am also just using a user here, but checkout the options for using api tokens or an oauth setup if this is used professionally.
Now we need to instruct systemd to reload all unit files
systemctl daemon-reload
And enable our service
systemctl enable --now grafana-kiosk
This will both enable and start the grafana-kiosk service. Not that this will take atleast 30 seconds to take effect because of the 30 seconds sleep. You can reduce or remove that at your own risk.
If it succeeds you should after a while see the same as before when you executed the grafana-kiosk binary. Now it should display your dashboards instead tho.
If nothing happens or you get an error message, simply check with
systemctl status grafana-kiosk or using journalctl -u grafana-kiosk.
That should be it, you should now have a live dashboard view, which will be automatically updated, when you update your grafana setup